> ## Documentation Index
> Fetch the complete documentation index at: https://lightdash-docs-many-to-many.mintlify.site/llms.txt
> Use this file to discover all available pages before exploring further.
# Dashboards as code
> You can download your charts and dashboards as code, make changes, then upload your changes back to your Lightdash project using the CLI. Content as code is also useful for creating new Lightdash projects where you want the content to be copied from an existing project and added to your new project.
## `lightdash download`
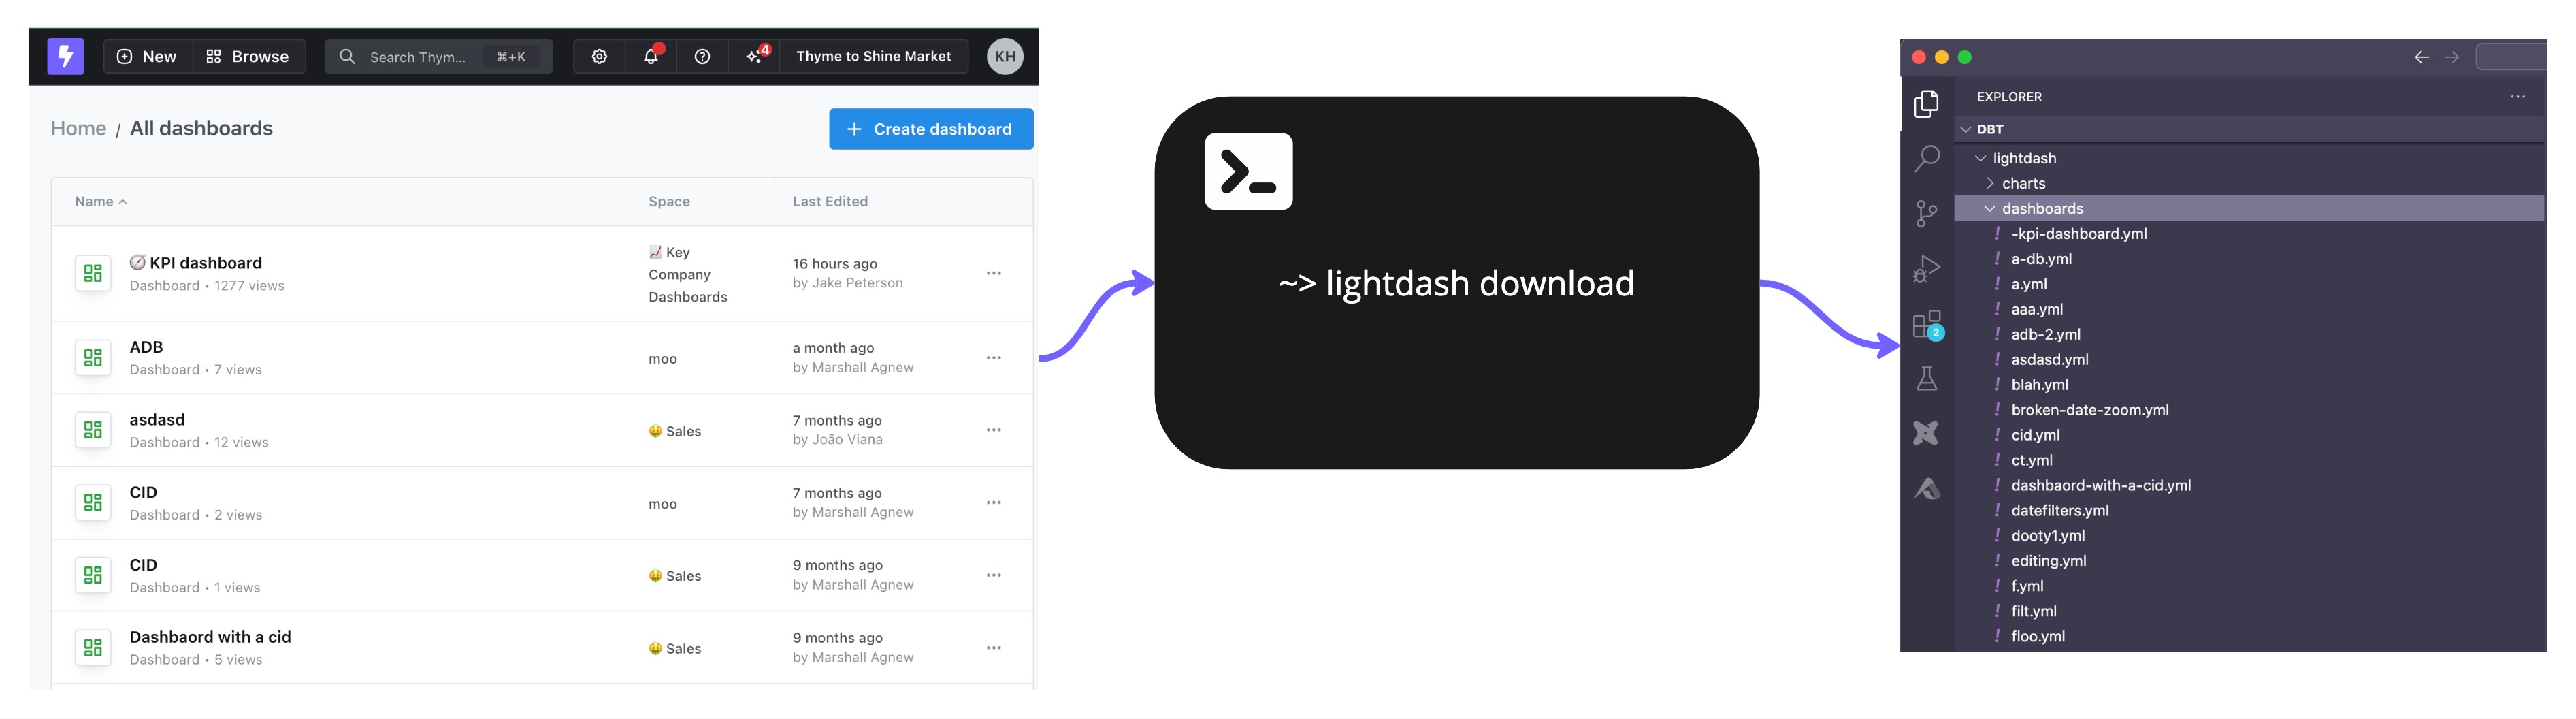
From the [Lightdash CLI](/references/lightdash-cli), you can use the command `lightdash download` to download all of the charts and dashboards from your Lightdash project as code. All of the charts and dashboards will be written as .yml files to a `lightdash` directory wherever you're running the command.
E.g. if you're running this command inside your dbt directory (eg: `/home/javi/dbt`) then it will create a folder (`/home/javi/dbt/lightdash`). If you're running this command in `/home/javi/documents` it will create the folder in `/home/javi/documents/lightdash`.
 ##### Running `lightdash download` will overwrite any changes you have locally
For example:
* I run `lightdash download` and one of the charts that is downloaded is `emea-revenue-per-month.yml`
* I make some changes to the `emea-revenue-per-month.yml` file and save them
* I **do not** upload my changes, they are just saved locally
* I run `lightdash download` again
* The changes I made to `emea-revenue-per-month.yml` will be overwritten by the latest chart version downloaded from the Lightdash application
### Select specific items to download
##### Use `lightdash download -c` or `lightdash download --charts` to select specific charts
If you only want to download specific charts to manage as code, you can use the chart selector in the download command.
For example, if I only wanted to download a specific saved chart as code, I would run the command:
```bash
lightdash download -c https://app.lightdash.cloud/the-url-to-my-saved-chart
```
You can use the chart's SLUG, UUID, or the URL to the saved chart to select the chart.
##### Use `lightdash download -d` or `lightdash download --dashboards` to select specific dashboards
This will download the dashboard and all of the charts in the dashboard as code. For example, if I only wanted to download a specific dashboard as code, I would run the command:
```bash
lightdash download -d https://app.lightdash.cloud/the-url-to-my-dashboard
```
You can use the dashboard's SLUG, UUID, or the URL to the dashboard to select the dashboard.
##### To select multiple charts or dashboards, add a space between the items.
For example, this command would select two charts to download:
```bash
lightdash download -c https://app.lightdash.cloud/the-url-to-my-first-saved-chart https://app.lightdash.cloud/the-url-to-my-second-saved-chart
```
You can combine charts and dashboards selection in a single command. For example, this command would download a chart and a dashboard:
```bash
lightdash download -c https://app.lightdash.cloud/the-url-to-my-first-saved-chart -d https://app.lightdash.cloud/the-url-to-my-dashboard
```
### Specify a download path
Use `lightdash download -p` or `lightdash download --path` to specify a directory to download to
By default, `lightdash download` will create a new `lightdash` directory in your current working directory and write the content there. You can customize the directory that you write to using `lightdash download -p`. For example:
```bash
lightdash download -p /Users/katiehindson/lightdash/lightdash-analytics/
```
This will create: `/Users/katiehindson/lightdash/lightdash-analytics/charts/` and `/Users/katiehindson/lightdash/lightdash-analytics/dashboards` and save the content to these new folders.
You can also use relative paths like:
```bash
lightdash download -p ../
```
### Download an entire project
Use `lightdash download --project ` to download all content from a specific project
Running `lightdash download` will download all content from your current set project (set using `lightdash config set-project`). But, you can download content from another project using `lightdash download --project my-project-uuid`. For example:
```bash
lightdash download --project 21eef0b9-5bae-40f3-851e-9554588e71a6
```
You can find a project's UUID from your Lightdash URL. For example, `https://app.lightdash.cloud/projects/123-project-uuid/`. Here, the project UUID here is `123-project-uuid` .
## `lightdash upload`
`lightdash upload` updates any content as code to your project.
From the [Lightdash CLI](/references/lightdash-cli), you can use the command `lightdash upload` to upload any changes you've made to your charts or dashboards as code. To upload new charts that you've created as code to your Lightdash project, you need to run `lightdash upload --force`
### Select specific items to upload
##### Use `lightdash upload -c` or `lightdash upload --charts` to select specific charts
For example, if I only wanted to upload a specific saved chart as code, I would run the command:
```bash
lightdash upload -c my-saved-chart-slug
```
You must specify the chart using the chart's SLUG.
##### Use `lightdash upload -d` or `lightdash upload --dashboards` to select specific dashboards
For example, if I only wanted to upload a specific dashboard as code, I would run the command:
```bash
lightdash upload -d my-dashboard-slug
```
You must specify the dashboard using the dashboard's SLUG.
##### To select multiple charts or dashboards, add a space between the items
For example, this command would select two charts to upload:
```bash
lightdash upload -c my-saved-chart-1-slug my-saved-chart-2-slug
```
### Specify a path to upload from.
Use `lightdash upload -p` or `lightdash upload --path` to specify a directory to upload from.
By default, `lightdash upload` will upload all items you have saved in the `lightdash` directory in your current working directory. You can customize the directory that you upload from using `lightdash upload -p`. For example:
```bash
lightdash upload -p /Users/katiehindson/lightdash/lightdash-analytics/
```
This will upload all content from: `/Users/katiehindson/lightdash/lightdash-analytics/charts/` and `/Users/katiehindson/lightdash/lightdash-analytics/dashboards`.
You can also use relative paths like:
```bash
lightdash download -p ../
```
### Specify a project to upload to
Use `lightdash upload --project ` to upload your content to a specific project.
Running `lightdash upload` will upload all content to your current set project (set using `lightdash config set-project`). But, you can upload content to another project using `lightdash upload --project my-project-uuid`. For example:
```bash
lightdash upload --project 21eef0b9-5bae-40f3-851e-9554588e71a6
```
You can find a project's UUID from your Lightdash URL. For example, `https://app.lightdash.cloud/projects/123-project-uuid/`. Here, the project UUID here is `123-project-uuid` .
##### Only content as code that you've made changes to will be uploaded
For example:
* I have a chart that I've downloaded as code called `total-sales-worldwide.yml` in my `lightdash/` directory
* I only make changes to that chart's .yml
* I run `lightdash upload`
* `total-sales-worldwide.yml` is the only file that gets uploaded because it's the only file that I made changes to
For example:
* Katie has a chart that she's downloaded as code called `total-sales-worldwide.yml` in her `lightdash/` directory
* She doesn't make any changes to the chart as code
* Javi opens the same chart, `Total sales worldwide`, in the Lightdash application, makes some changes, and saves them
* Now, Katie's `total-sales-worldwide.yml` and the `Total sales worldwide` chart in the application are different.
* Katie runs `lightdash upload`
* Katie's `total-sales-worldwide.yml` does **not** get uploaded because she made no changes to the chart as code
* Javi's changes to the `Total sales worldwide` chart that he made in the Lightdash application are **not** overwritten (the version he created is what we see in the Lightdash application)
##### Content that's been downloaded as code can still be updated in the Lightdash application
For example:
* There is a Lightdash project called `Stellar Marketing`
* Priyanka runs `lightdash download` and downloads all of the project's content as code, including a chart called `Total new clients`
* Jake opens the `Total new clients` chart in the Lightdash application and makes some changes
* Priyanka doesn't run `lightdash download`, so the `total-new-clients.yml` chart that Priyanka has as code is the old version of the chart, before Jake updated it.
* Priyanka makes changes to `total-new-clients.yml` then runs `lightdash upload` and uploads her changes and overwrites the changes that Jake made in the Lightdash application.
* Both Jake and Priyanka can update the same chart as code, or in the Lightdash application.
## Lightdash content templates
You can use the `lightdash download` and `lightdash upload` commands to easily build templates for Lightdash content and reuse these templates to build new or update existing projects.
### Creating a new Lightdash project from a Lightdash template
If you're creating many dbt projects with similar models and want to easily spin up new versions of these projects, but with different table, field, or chart names, then you can use content as code to create a Lightdash template of your project to reuse.
To do this, you'll need to:
* Take your existing Lightdash project with all of the content that you want to copy.
* In the CLI, run `lightdash download` to download all of the content as code from the project
* Navigate to your new dbt project that you want to connect to Lightdash.
* Copy-paste over the `lightdash/` directory inside your new dbt project with all of the content as code from your template project (or, only copy over the content that you want to use in your new project)
* Once you're happy with your content, you're going to run `lightdash config set-project` and select your new Lightdash project from the list of projects
* Then, you'll run `lightdash upload --force` to upload all of the content as code you've added in your `lightdash/` directory to your new Lightdash project
### Adding content to an existing project from a Lightdash template
Sometimes, if you're managing multiple dbt projects with similar models, you want to be able to easily create and manage the same charts and dashboards across all of the projects at the same time. You can do this with content as code to create a Lightdash template project.
* You want to create a Lightdash project that only contains all of the content that you want to share across your projects
* From your CLI, you can run `lightdash download` to download all of this content as code
* You can then copy-paste the .yml files that get written across to any of the other dbt projects you have where you want to reuse the same charts and dashboards.
* Once you've copied over any content that you wanted to manage across projects, from the CLI, you should run `lightdash config set-project` and select the project where you've added these new charts/dashboards as code to.
* Then, you should run `lightdash upload` to upload all of the new content as code.
### Using community templates
Alongside making templates from your own project, you can also use templates from the [lightdash-templates](https://github.com/lightdash/lightdash-templates) repo to quickly build dashboards on top of common datasets.
For example, if you are using BigQuery as your data warehouse, you can use the community templates to build a usage tracking dashboard in a matter of minutes.
There are detailed instructions within the repo, but the general steps are as follows:
* Identify the content you wish to implement, and navigate to the relevant folder.
* Copy the content from the `Lightdash` folder into your dbt project.
* Run `lightdash upload --force` to push your new content to Lightdash.
Note that these templates still rely on access to an underlying dbt model containing the relevant data, you might need to create or adjust this following the instructions in the [lightdash-templates](https://github.com/lightdash/lightdash-templates) repo.
## Dashboard as code yml reference
The yml configuration for dashboards as code is extensive. It covers both dashboards and individual charts. The best way to start is often to create your content in the Lightdash UI, download it, and in most cases the structure will be fairly intuitive. Below are outlines of the structures you will find for both types of content to provide some additional context.
The examples below are not exhaustive, so if you have additional questions, you can always [reach out to our support team](/contact/contact_info) for more details.
### Dashboards
These are the simpler of the two content types.
Alongside the standard information, such as the name, description, updated at, slug and space information, you'll find details for each tile and the content that exists within it and detailed filter information.
Here's an example of a basic dashboard with three tiles and a couple of filters. We've added some comments for context!
```yml Dashboards as code example [expandable]
name: My cool dashboard
description: Shows a few of our KPIs
updatedAt: "2025-01-01T10:15:47.406Z"
tiles:
# Each tile is represented here with a co-ordinate
# referencing their location on the dashboard grid.
- x: 18
"y": 5
h: 6
w: 18
tabUuid: null
type: saved_chart
properties:
title: ""
hideTitle: false
chartSlug: company-sales
# Chart tiles always point towards a specific and unique chart slug
# this will match up with the chart slug from the charts yml code.
tileSlug: company-sales
- x: 0
"y": 5
h: 6
w: 18
tabUuid: null
type: saved_chart
properties:
title: ""
hideTitle: false
chartSlug: customer-counts
tileSlug: customer-counts
- x: 0
"y": 0
h: 5
w: 36
tabUuid: null
type: markdown
properties:
title: My cool dashboard
hideTitle: false
content: |- # Markdown tiles have their config stored here under 'content'.
This is an example of a markdown tile
Emojis work here 🎉
So do
- bullet
- points
And so on...
filters:
# Filters are split by whether they are performed
# on a metric, dimension or table calculation.
# Here we have two filters, both on dimensions.
metrics: []
dimensions:
- target:
# All of the config for a single filter exists under target.
# Here we can see the underlying field that is being used to filter
# and the default value assigned if one exists.
fieldId: orders_date_day
fieldName: date_day
tableName: orders
values:
- 30
disabled: false
operator: inThePast
settings:
completed: false
unitOfTime: days
tileTargets: {}
# Note that if we were just applying the filter to specific tiles
# on the dash, we would see that info here.
- target:
fieldId: customers_is_verified
fieldName: is_verified
tableName: customers
values: []
disabled: false
operator: notNull
tileTargets: {}
tableCalculations: []
tabs: []
slug: my-cool-dashboard
spaceSlug: my-space
version: 1
downloadedAt: "2025-01-02T10:15:47.406Z"
```
### Charts
Charts store a large amount of configuration, and so are more complex and more variable that what you will find within the dashboard yml files.
Again, you will find basic information such as the name, description, updated at, slug and space information. But on top of that we also store all of the possible configuration you might have included in a chart. This includes things like:
* Dimensions
* Metrics
* Custom Fields
* Table Calculations
* Filters
* Visualization Configuration
* Formatting
* Sorting
Each of the above can have a number of sub categories of information. With that in mind, below is an example highlighting *most* of the above options, but you might come across variances depending on your exact chart configs!
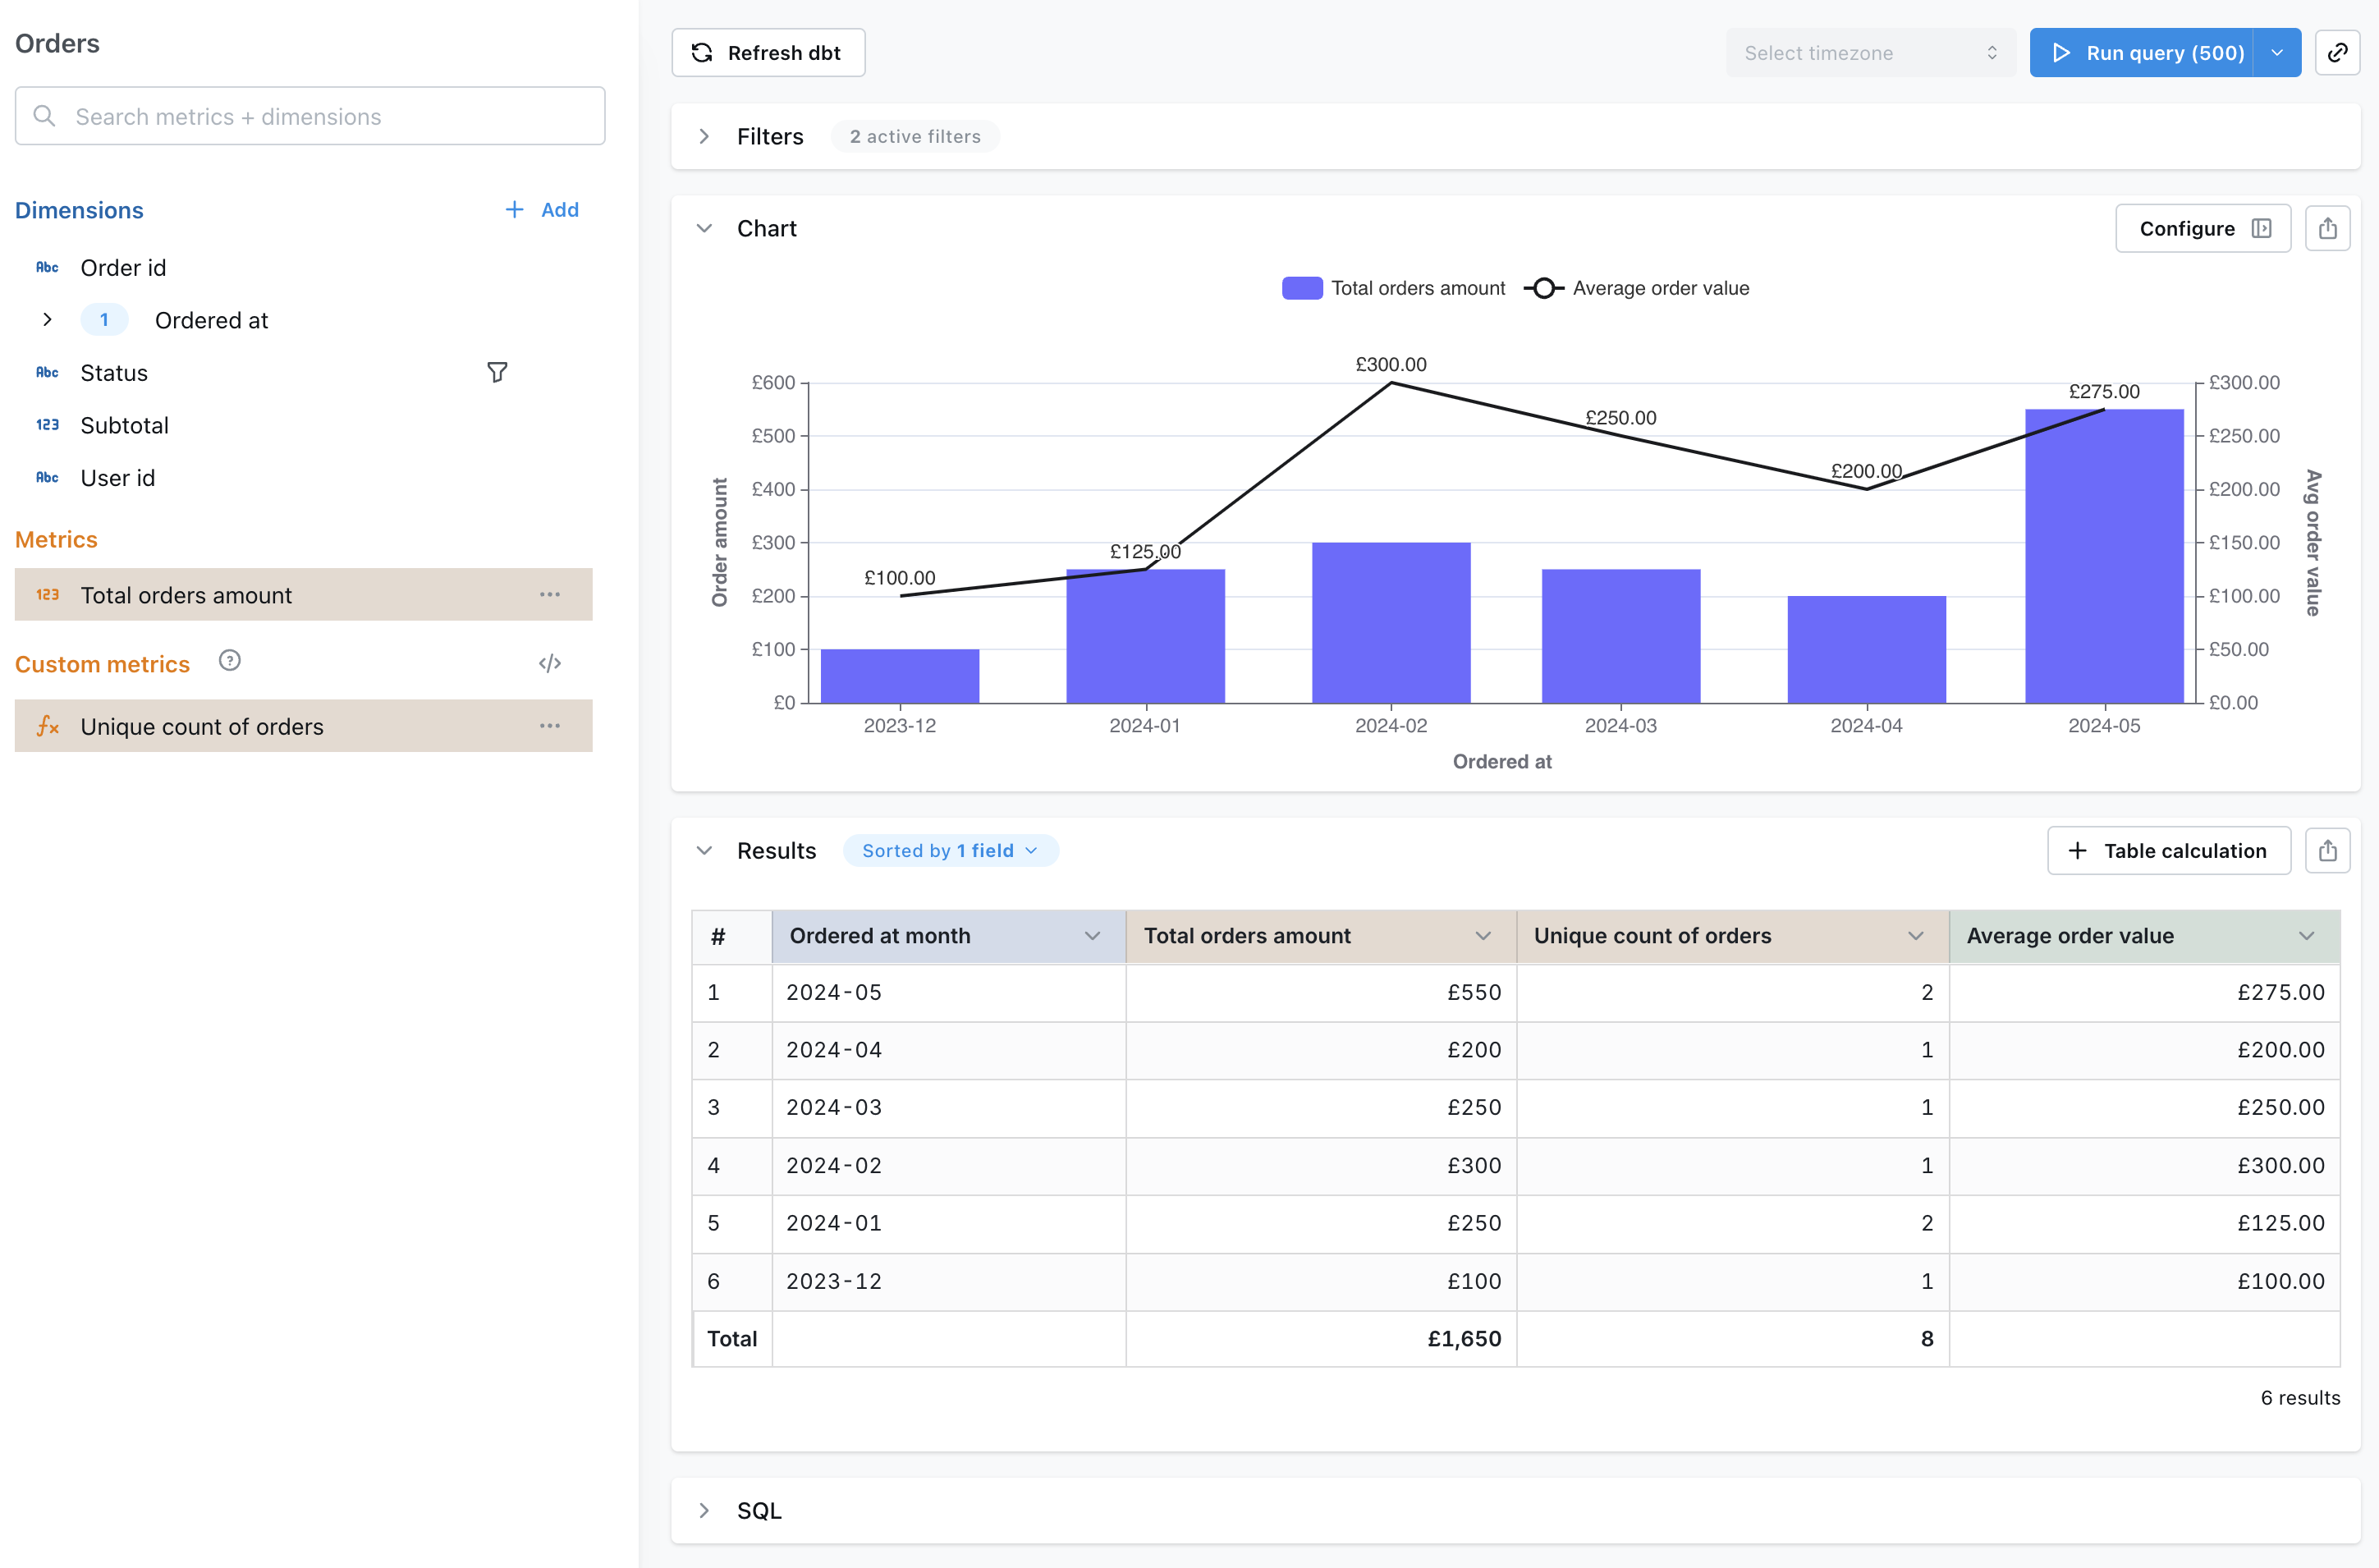
Here's an image of the chart that we have generated code for, and just below that is the code itself.
```yml Charts as code example [expandable]
name: My cool chart
description: Shows sales since December 2023
tableName: orders
updatedAt: "2024-02-12T18:12:03.345Z"
metricQuery:
# metricQuery stores all the information that
# allows us to generate the results set.
exploreName: orders
dimensions:
- orders_ordered_at_month
metrics:
- orders_total_orders_amount
- orders_order_id_unique_count_of_orders
filters:
dimensions:
and:
# here we list all 'and' type filters
# note we might also have 'or' type filters under an 'or' option
- target:
fieldId: orders_ordered_at_month
values:
- 2023-12
operator: greaterThanOrEqual
required: false
- target:
fieldId: orders_status
values:
- shipped
- completed
- placed
operator: equals
required: false
sorts:
- fieldId: orders_ordered_at_month
descending: true
limit: 500
metricOverrides:
# Metric overrides are often in the form of formatting changes.
# here we are changing a basic number to a currency.
orders_total_orders_amount:
formatOptions:
type: currency
round: 0
currency: GBP
separator: default
tableCalculations:
- name: average_order_value_1
displayName: Average order value
sql: >- # Table calculation config is stored directly in yml
${orders.total_orders_amount}/${orders.order_id_unique_count_of_orders}
format:
type: currency
round: 2
currency: GBP
separator: default
type: number
additionalMetrics:
# This is an example of a custom metric that
# has been added by the user in the UI
- name: order_id_unique_count_of_orders
label: Unique count of orders
description: "Count distinct of Order id on the table Orders"
sql: ${TABLE}.order_id
table: orders
type: count_distinct
baseDimensionName: order_id
formatOptions:
type: default
separator: default
customDimensions: []
chartConfig:
# Here is where all the config is stored to
# translate your results set into a chart.
# Note that this is the section that changes the most
# with different chart types, but it's usually fairly
# intuitive to understand!
type: cartesian
config:
layout:
xField: orders_ordered_at_month
yField:
- orders_total_orders_amount
- average_order_value_1
eChartsConfig:
yAxis:
- name: Order amount
- name: Avg order value
series:
# Here you can see all of the details around the chart config,
# I have a complex dual axis chart here, with both bars and lines.
- type: bar
encode:
xRef:
field: orders_ordered_at_month
yRef:
field: orders_total_orders_amount
yAxisIndex: 0
isFilteredOut: false
- type: line
label:
show: true
position: top
encode:
xRef:
field: orders_ordered_at_month
yRef:
field: average_order_value_1
yAxisIndex: 1
# This index indicates that this is the right hand side y axis.
isFilteredOut: false
tooltip: "" # If I had custom tooltip config, it would show up here!
slug: my-cool-chart
tableConfig:
columnOrder:
- orders_ordered_at_month
- orders_total_orders_amount
- orders_order_id_unique_count_of_orders
- average_order_value_1
spaceSlug: my-space
version: 1
downloadedAt: "2025-04-09T10:44:01.104Z"
```
##### Running `lightdash download` will overwrite any changes you have locally
For example:
* I run `lightdash download` and one of the charts that is downloaded is `emea-revenue-per-month.yml`
* I make some changes to the `emea-revenue-per-month.yml` file and save them
* I **do not** upload my changes, they are just saved locally
* I run `lightdash download` again
* The changes I made to `emea-revenue-per-month.yml` will be overwritten by the latest chart version downloaded from the Lightdash application
### Select specific items to download
##### Use `lightdash download -c` or `lightdash download --charts` to select specific charts
If you only want to download specific charts to manage as code, you can use the chart selector in the download command.
For example, if I only wanted to download a specific saved chart as code, I would run the command:
```bash
lightdash download -c https://app.lightdash.cloud/the-url-to-my-saved-chart
```
You can use the chart's SLUG, UUID, or the URL to the saved chart to select the chart.
##### Use `lightdash download -d` or `lightdash download --dashboards` to select specific dashboards
This will download the dashboard and all of the charts in the dashboard as code. For example, if I only wanted to download a specific dashboard as code, I would run the command:
```bash
lightdash download -d https://app.lightdash.cloud/the-url-to-my-dashboard
```
You can use the dashboard's SLUG, UUID, or the URL to the dashboard to select the dashboard.
##### To select multiple charts or dashboards, add a space between the items.
For example, this command would select two charts to download:
```bash
lightdash download -c https://app.lightdash.cloud/the-url-to-my-first-saved-chart https://app.lightdash.cloud/the-url-to-my-second-saved-chart
```
You can combine charts and dashboards selection in a single command. For example, this command would download a chart and a dashboard:
```bash
lightdash download -c https://app.lightdash.cloud/the-url-to-my-first-saved-chart -d https://app.lightdash.cloud/the-url-to-my-dashboard
```
### Specify a download path
Use `lightdash download -p` or `lightdash download --path` to specify a directory to download to
By default, `lightdash download` will create a new `lightdash` directory in your current working directory and write the content there. You can customize the directory that you write to using `lightdash download -p`. For example:
```bash
lightdash download -p /Users/katiehindson/lightdash/lightdash-analytics/
```
This will create: `/Users/katiehindson/lightdash/lightdash-analytics/charts/` and `/Users/katiehindson/lightdash/lightdash-analytics/dashboards` and save the content to these new folders.
You can also use relative paths like:
```bash
lightdash download -p ../
```
### Download an entire project
Use `lightdash download --project ` to download all content from a specific project
Running `lightdash download` will download all content from your current set project (set using `lightdash config set-project`). But, you can download content from another project using `lightdash download --project my-project-uuid`. For example:
```bash
lightdash download --project 21eef0b9-5bae-40f3-851e-9554588e71a6
```
You can find a project's UUID from your Lightdash URL. For example, `https://app.lightdash.cloud/projects/123-project-uuid/`. Here, the project UUID here is `123-project-uuid` .
## `lightdash upload`
`lightdash upload` updates any content as code to your project.
From the [Lightdash CLI](/references/lightdash-cli), you can use the command `lightdash upload` to upload any changes you've made to your charts or dashboards as code. To upload new charts that you've created as code to your Lightdash project, you need to run `lightdash upload --force`
### Select specific items to upload
##### Use `lightdash upload -c` or `lightdash upload --charts` to select specific charts
For example, if I only wanted to upload a specific saved chart as code, I would run the command:
```bash
lightdash upload -c my-saved-chart-slug
```
You must specify the chart using the chart's SLUG.
##### Use `lightdash upload -d` or `lightdash upload --dashboards` to select specific dashboards
For example, if I only wanted to upload a specific dashboard as code, I would run the command:
```bash
lightdash upload -d my-dashboard-slug
```
You must specify the dashboard using the dashboard's SLUG.
##### To select multiple charts or dashboards, add a space between the items
For example, this command would select two charts to upload:
```bash
lightdash upload -c my-saved-chart-1-slug my-saved-chart-2-slug
```
### Specify a path to upload from.
Use `lightdash upload -p` or `lightdash upload --path` to specify a directory to upload from.
By default, `lightdash upload` will upload all items you have saved in the `lightdash` directory in your current working directory. You can customize the directory that you upload from using `lightdash upload -p`. For example:
```bash
lightdash upload -p /Users/katiehindson/lightdash/lightdash-analytics/
```
This will upload all content from: `/Users/katiehindson/lightdash/lightdash-analytics/charts/` and `/Users/katiehindson/lightdash/lightdash-analytics/dashboards`.
You can also use relative paths like:
```bash
lightdash download -p ../
```
### Specify a project to upload to
Use `lightdash upload --project ` to upload your content to a specific project.
Running `lightdash upload` will upload all content to your current set project (set using `lightdash config set-project`). But, you can upload content to another project using `lightdash upload --project my-project-uuid`. For example:
```bash
lightdash upload --project 21eef0b9-5bae-40f3-851e-9554588e71a6
```
You can find a project's UUID from your Lightdash URL. For example, `https://app.lightdash.cloud/projects/123-project-uuid/`. Here, the project UUID here is `123-project-uuid` .
##### Only content as code that you've made changes to will be uploaded
For example:
* I have a chart that I've downloaded as code called `total-sales-worldwide.yml` in my `lightdash/` directory
* I only make changes to that chart's .yml
* I run `lightdash upload`
* `total-sales-worldwide.yml` is the only file that gets uploaded because it's the only file that I made changes to
For example:
* Katie has a chart that she's downloaded as code called `total-sales-worldwide.yml` in her `lightdash/` directory
* She doesn't make any changes to the chart as code
* Javi opens the same chart, `Total sales worldwide`, in the Lightdash application, makes some changes, and saves them
* Now, Katie's `total-sales-worldwide.yml` and the `Total sales worldwide` chart in the application are different.
* Katie runs `lightdash upload`
* Katie's `total-sales-worldwide.yml` does **not** get uploaded because she made no changes to the chart as code
* Javi's changes to the `Total sales worldwide` chart that he made in the Lightdash application are **not** overwritten (the version he created is what we see in the Lightdash application)
##### Content that's been downloaded as code can still be updated in the Lightdash application
For example:
* There is a Lightdash project called `Stellar Marketing`
* Priyanka runs `lightdash download` and downloads all of the project's content as code, including a chart called `Total new clients`
* Jake opens the `Total new clients` chart in the Lightdash application and makes some changes
* Priyanka doesn't run `lightdash download`, so the `total-new-clients.yml` chart that Priyanka has as code is the old version of the chart, before Jake updated it.
* Priyanka makes changes to `total-new-clients.yml` then runs `lightdash upload` and uploads her changes and overwrites the changes that Jake made in the Lightdash application.
* Both Jake and Priyanka can update the same chart as code, or in the Lightdash application.
## Lightdash content templates
You can use the `lightdash download` and `lightdash upload` commands to easily build templates for Lightdash content and reuse these templates to build new or update existing projects.
### Creating a new Lightdash project from a Lightdash template
If you're creating many dbt projects with similar models and want to easily spin up new versions of these projects, but with different table, field, or chart names, then you can use content as code to create a Lightdash template of your project to reuse.
To do this, you'll need to:
* Take your existing Lightdash project with all of the content that you want to copy.
* In the CLI, run `lightdash download` to download all of the content as code from the project
* Navigate to your new dbt project that you want to connect to Lightdash.
* Copy-paste over the `lightdash/` directory inside your new dbt project with all of the content as code from your template project (or, only copy over the content that you want to use in your new project)
* Once you're happy with your content, you're going to run `lightdash config set-project` and select your new Lightdash project from the list of projects
* Then, you'll run `lightdash upload --force` to upload all of the content as code you've added in your `lightdash/` directory to your new Lightdash project
### Adding content to an existing project from a Lightdash template
Sometimes, if you're managing multiple dbt projects with similar models, you want to be able to easily create and manage the same charts and dashboards across all of the projects at the same time. You can do this with content as code to create a Lightdash template project.
* You want to create a Lightdash project that only contains all of the content that you want to share across your projects
* From your CLI, you can run `lightdash download` to download all of this content as code
* You can then copy-paste the .yml files that get written across to any of the other dbt projects you have where you want to reuse the same charts and dashboards.
* Once you've copied over any content that you wanted to manage across projects, from the CLI, you should run `lightdash config set-project` and select the project where you've added these new charts/dashboards as code to.
* Then, you should run `lightdash upload` to upload all of the new content as code.
### Using community templates
Alongside making templates from your own project, you can also use templates from the [lightdash-templates](https://github.com/lightdash/lightdash-templates) repo to quickly build dashboards on top of common datasets.
For example, if you are using BigQuery as your data warehouse, you can use the community templates to build a usage tracking dashboard in a matter of minutes.
There are detailed instructions within the repo, but the general steps are as follows:
* Identify the content you wish to implement, and navigate to the relevant folder.
* Copy the content from the `Lightdash` folder into your dbt project.
* Run `lightdash upload --force` to push your new content to Lightdash.
Note that these templates still rely on access to an underlying dbt model containing the relevant data, you might need to create or adjust this following the instructions in the [lightdash-templates](https://github.com/lightdash/lightdash-templates) repo.
## Dashboard as code yml reference
The yml configuration for dashboards as code is extensive. It covers both dashboards and individual charts. The best way to start is often to create your content in the Lightdash UI, download it, and in most cases the structure will be fairly intuitive. Below are outlines of the structures you will find for both types of content to provide some additional context.
The examples below are not exhaustive, so if you have additional questions, you can always [reach out to our support team](/contact/contact_info) for more details.
### Dashboards
These are the simpler of the two content types.
Alongside the standard information, such as the name, description, updated at, slug and space information, you'll find details for each tile and the content that exists within it and detailed filter information.
Here's an example of a basic dashboard with three tiles and a couple of filters. We've added some comments for context!
```yml Dashboards as code example [expandable]
name: My cool dashboard
description: Shows a few of our KPIs
updatedAt: "2025-01-01T10:15:47.406Z"
tiles:
# Each tile is represented here with a co-ordinate
# referencing their location on the dashboard grid.
- x: 18
"y": 5
h: 6
w: 18
tabUuid: null
type: saved_chart
properties:
title: ""
hideTitle: false
chartSlug: company-sales
# Chart tiles always point towards a specific and unique chart slug
# this will match up with the chart slug from the charts yml code.
tileSlug: company-sales
- x: 0
"y": 5
h: 6
w: 18
tabUuid: null
type: saved_chart
properties:
title: ""
hideTitle: false
chartSlug: customer-counts
tileSlug: customer-counts
- x: 0
"y": 0
h: 5
w: 36
tabUuid: null
type: markdown
properties:
title: My cool dashboard
hideTitle: false
content: |- # Markdown tiles have their config stored here under 'content'.
This is an example of a markdown tile
Emojis work here 🎉
So do
- bullet
- points
And so on...
filters:
# Filters are split by whether they are performed
# on a metric, dimension or table calculation.
# Here we have two filters, both on dimensions.
metrics: []
dimensions:
- target:
# All of the config for a single filter exists under target.
# Here we can see the underlying field that is being used to filter
# and the default value assigned if one exists.
fieldId: orders_date_day
fieldName: date_day
tableName: orders
values:
- 30
disabled: false
operator: inThePast
settings:
completed: false
unitOfTime: days
tileTargets: {}
# Note that if we were just applying the filter to specific tiles
# on the dash, we would see that info here.
- target:
fieldId: customers_is_verified
fieldName: is_verified
tableName: customers
values: []
disabled: false
operator: notNull
tileTargets: {}
tableCalculations: []
tabs: []
slug: my-cool-dashboard
spaceSlug: my-space
version: 1
downloadedAt: "2025-01-02T10:15:47.406Z"
```
### Charts
Charts store a large amount of configuration, and so are more complex and more variable that what you will find within the dashboard yml files.
Again, you will find basic information such as the name, description, updated at, slug and space information. But on top of that we also store all of the possible configuration you might have included in a chart. This includes things like:
* Dimensions
* Metrics
* Custom Fields
* Table Calculations
* Filters
* Visualization Configuration
* Formatting
* Sorting
Each of the above can have a number of sub categories of information. With that in mind, below is an example highlighting *most* of the above options, but you might come across variances depending on your exact chart configs!
Here's an image of the chart that we have generated code for, and just below that is the code itself.

```yml Charts as code example [expandable]
name: My cool chart
description: Shows sales since December 2023
tableName: orders
updatedAt: "2024-02-12T18:12:03.345Z"
metricQuery:
# metricQuery stores all the information that
# allows us to generate the results set.
exploreName: orders
dimensions:
- orders_ordered_at_month
metrics:
- orders_total_orders_amount
- orders_order_id_unique_count_of_orders
filters:
dimensions:
and:
# here we list all 'and' type filters
# note we might also have 'or' type filters under an 'or' option
- target:
fieldId: orders_ordered_at_month
values:
- 2023-12
operator: greaterThanOrEqual
required: false
- target:
fieldId: orders_status
values:
- shipped
- completed
- placed
operator: equals
required: false
sorts:
- fieldId: orders_ordered_at_month
descending: true
limit: 500
metricOverrides:
# Metric overrides are often in the form of formatting changes.
# here we are changing a basic number to a currency.
orders_total_orders_amount:
formatOptions:
type: currency
round: 0
currency: GBP
separator: default
tableCalculations:
- name: average_order_value_1
displayName: Average order value
sql: >- # Table calculation config is stored directly in yml
${orders.total_orders_amount}/${orders.order_id_unique_count_of_orders}
format:
type: currency
round: 2
currency: GBP
separator: default
type: number
additionalMetrics:
# This is an example of a custom metric that
# has been added by the user in the UI
- name: order_id_unique_count_of_orders
label: Unique count of orders
description: "Count distinct of Order id on the table Orders"
sql: ${TABLE}.order_id
table: orders
type: count_distinct
baseDimensionName: order_id
formatOptions:
type: default
separator: default
customDimensions: []
chartConfig:
# Here is where all the config is stored to
# translate your results set into a chart.
# Note that this is the section that changes the most
# with different chart types, but it's usually fairly
# intuitive to understand!
type: cartesian
config:
layout:
xField: orders_ordered_at_month
yField:
- orders_total_orders_amount
- average_order_value_1
eChartsConfig:
yAxis:
- name: Order amount
- name: Avg order value
series:
# Here you can see all of the details around the chart config,
# I have a complex dual axis chart here, with both bars and lines.
- type: bar
encode:
xRef:
field: orders_ordered_at_month
yRef:
field: orders_total_orders_amount
yAxisIndex: 0
isFilteredOut: false
- type: line
label:
show: true
position: top
encode:
xRef:
field: orders_ordered_at_month
yRef:
field: average_order_value_1
yAxisIndex: 1
# This index indicates that this is the right hand side y axis.
isFilteredOut: false
tooltip: "" # If I had custom tooltip config, it would show up here!
slug: my-cool-chart
tableConfig:
columnOrder:
- orders_ordered_at_month
- orders_total_orders_amount
- orders_order_id_unique_count_of_orders
- average_order_value_1
spaceSlug: my-space
version: 1
downloadedAt: "2025-04-09T10:44:01.104Z"
```