

Adding dimensions to your project
Read more about adding dimensions to your project in our docs here. For a dimension to appear in Lightdash, you just need to declare it in your dbt model’s YAML file.Dimension configuration
To customize the dimension, you can do it in your dbt model’s YAML file. If you want to declare multiple dimensions based on the same column, check additional dimensions section.Type
The types of your dimensions are pulled from your data warehouse, automatically. You can override these types using thetype meta tag in your .yml file. If you run lightdash generate to generate your .yml files, then Lightdash will add the type from your data warehouse to your .yml files automatically.
Description
Column descriptions in your YAML file are automatically pulled into Lightdash and you can spot them if you hover over the dimension name.
Quotes for escaping
When you surround text with double or single quotes it will escape the text between so that any special characters recognized by YAML will still pass through to the Lightdash UI.Greater than symbol for folded text blocks
When you use>- it allows you to type descriptions that are multiple lines long in the YAML file, but the text will be combined into a single line when parsed. The lightdash generate command will automatically add this to keep YAML files easy to read.
This description in YAML:
Vertical bar for preserving line breaks
If you need line breaks to stay in place when they show up in the Lightdash UI, you can use a| character like this:
Using dbt doc blocks
You can also use dbt docs blocks in descriptions, more on that here.Format
You can use theformat parameter to have your dimensions show in a particular format in Lightdash. Lightdash supports spreadsheet-style format expressions for all dimension types.
To help you build your format expression, we recommend using https://customformats.com/.
Example format expressions:
(Legacy) format and round options
(Legacy) format and round options
Spreadsheet-style format expressions are the recommended way of adding formatting to your metrics in Lightdash. There are legacy formatting options, listed below, which are less flexible than the spreadsheet-style formatting.These are the options:
If you use both legacy and spreadsheet-style formatting options for a single dimension, Lightdash will ignore the legacy
format and round options and only apply the spreadsheet-style formatting expression.Format (legacy)
Round (legacy)
You can round values to appear with a certain number of decimal points.Compact
You can compact values in your YAML. For example, if I wanted all of my revenue values to be shown in thousands (e.g.1,500 appears as 1.50K), then I would write something like this in my .yml:
Time intervals
Lightdash automatically adds intervals for dimensions that are timestamps or dates, so you don’t have to! For example, here we have the timestamp dimensioncreated defined in our dbt project:
created appears in our Lightdash project:
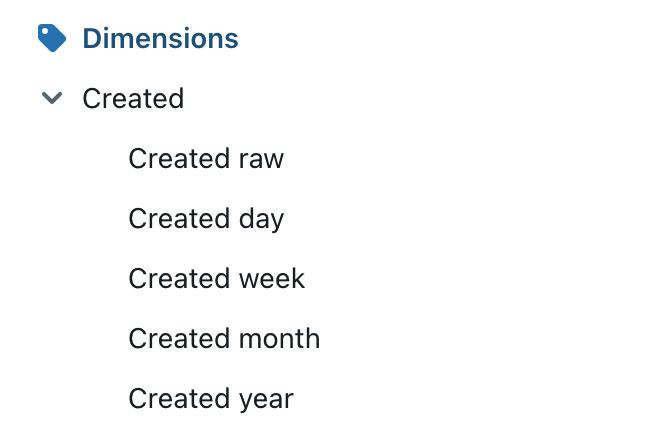
Formatting added to a date or timestamp dimension will be applied to all of the time intervals for that dimension.If you want to apply different formats for different time intervals, we recommend creating additional dimensions for time intervals where you want to customize the format.
By default, the time intervals we use are:
Date: [‘DAY’, ‘WEEK’, ‘MONTH’, ‘QUARTER’, ‘YEAR’] Timestamp: [‘RAW’, ‘DAY’, ‘WEEK’, ‘MONTH’, ‘QUARTER’, ‘YEAR’]To turn off time intervals for a dimension, set time_intervals: OFF
If you want to turn off time intervals for a dimension, you can simply set the time_intervals property to OFF.
In this example, created would now appear as a single, timestamp dimension without a drop-down list of time intervals in Lightdash:

To customize the time intervals for a dimension, you can use the time_intervals parameter.
If you specify time intervals manually, then this overrides the default time intervals used by Lightdash.
Date options
Numeric options
String options
Groups
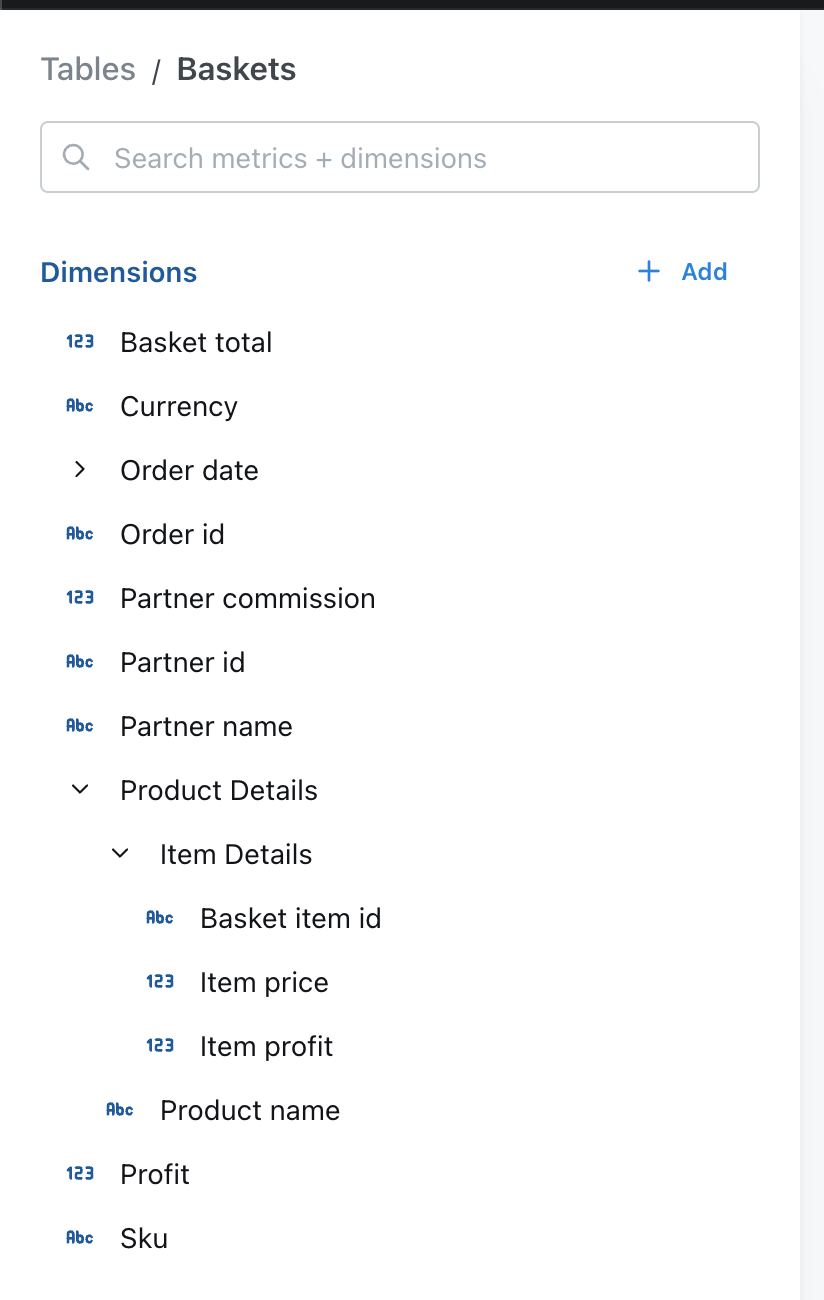
You can group your dimensions and metrics in the sidebar using thegroups parameter.
To do this, you need to set up group_details in the model’s configuration. Then, you can use these groups to organize metrics and dimensions. You can create nested groups up to 3 levels.
URLs
Lightdash users can interact with dimension values by clicking on them. If you’re already storing URLs in your models, you can create hyperlinks to those URLs in Lightdash, like so:How to add custom URLs
By adding custom urls you can configure the actions available to your users. Like linking to external tools, or taking actions in other tools.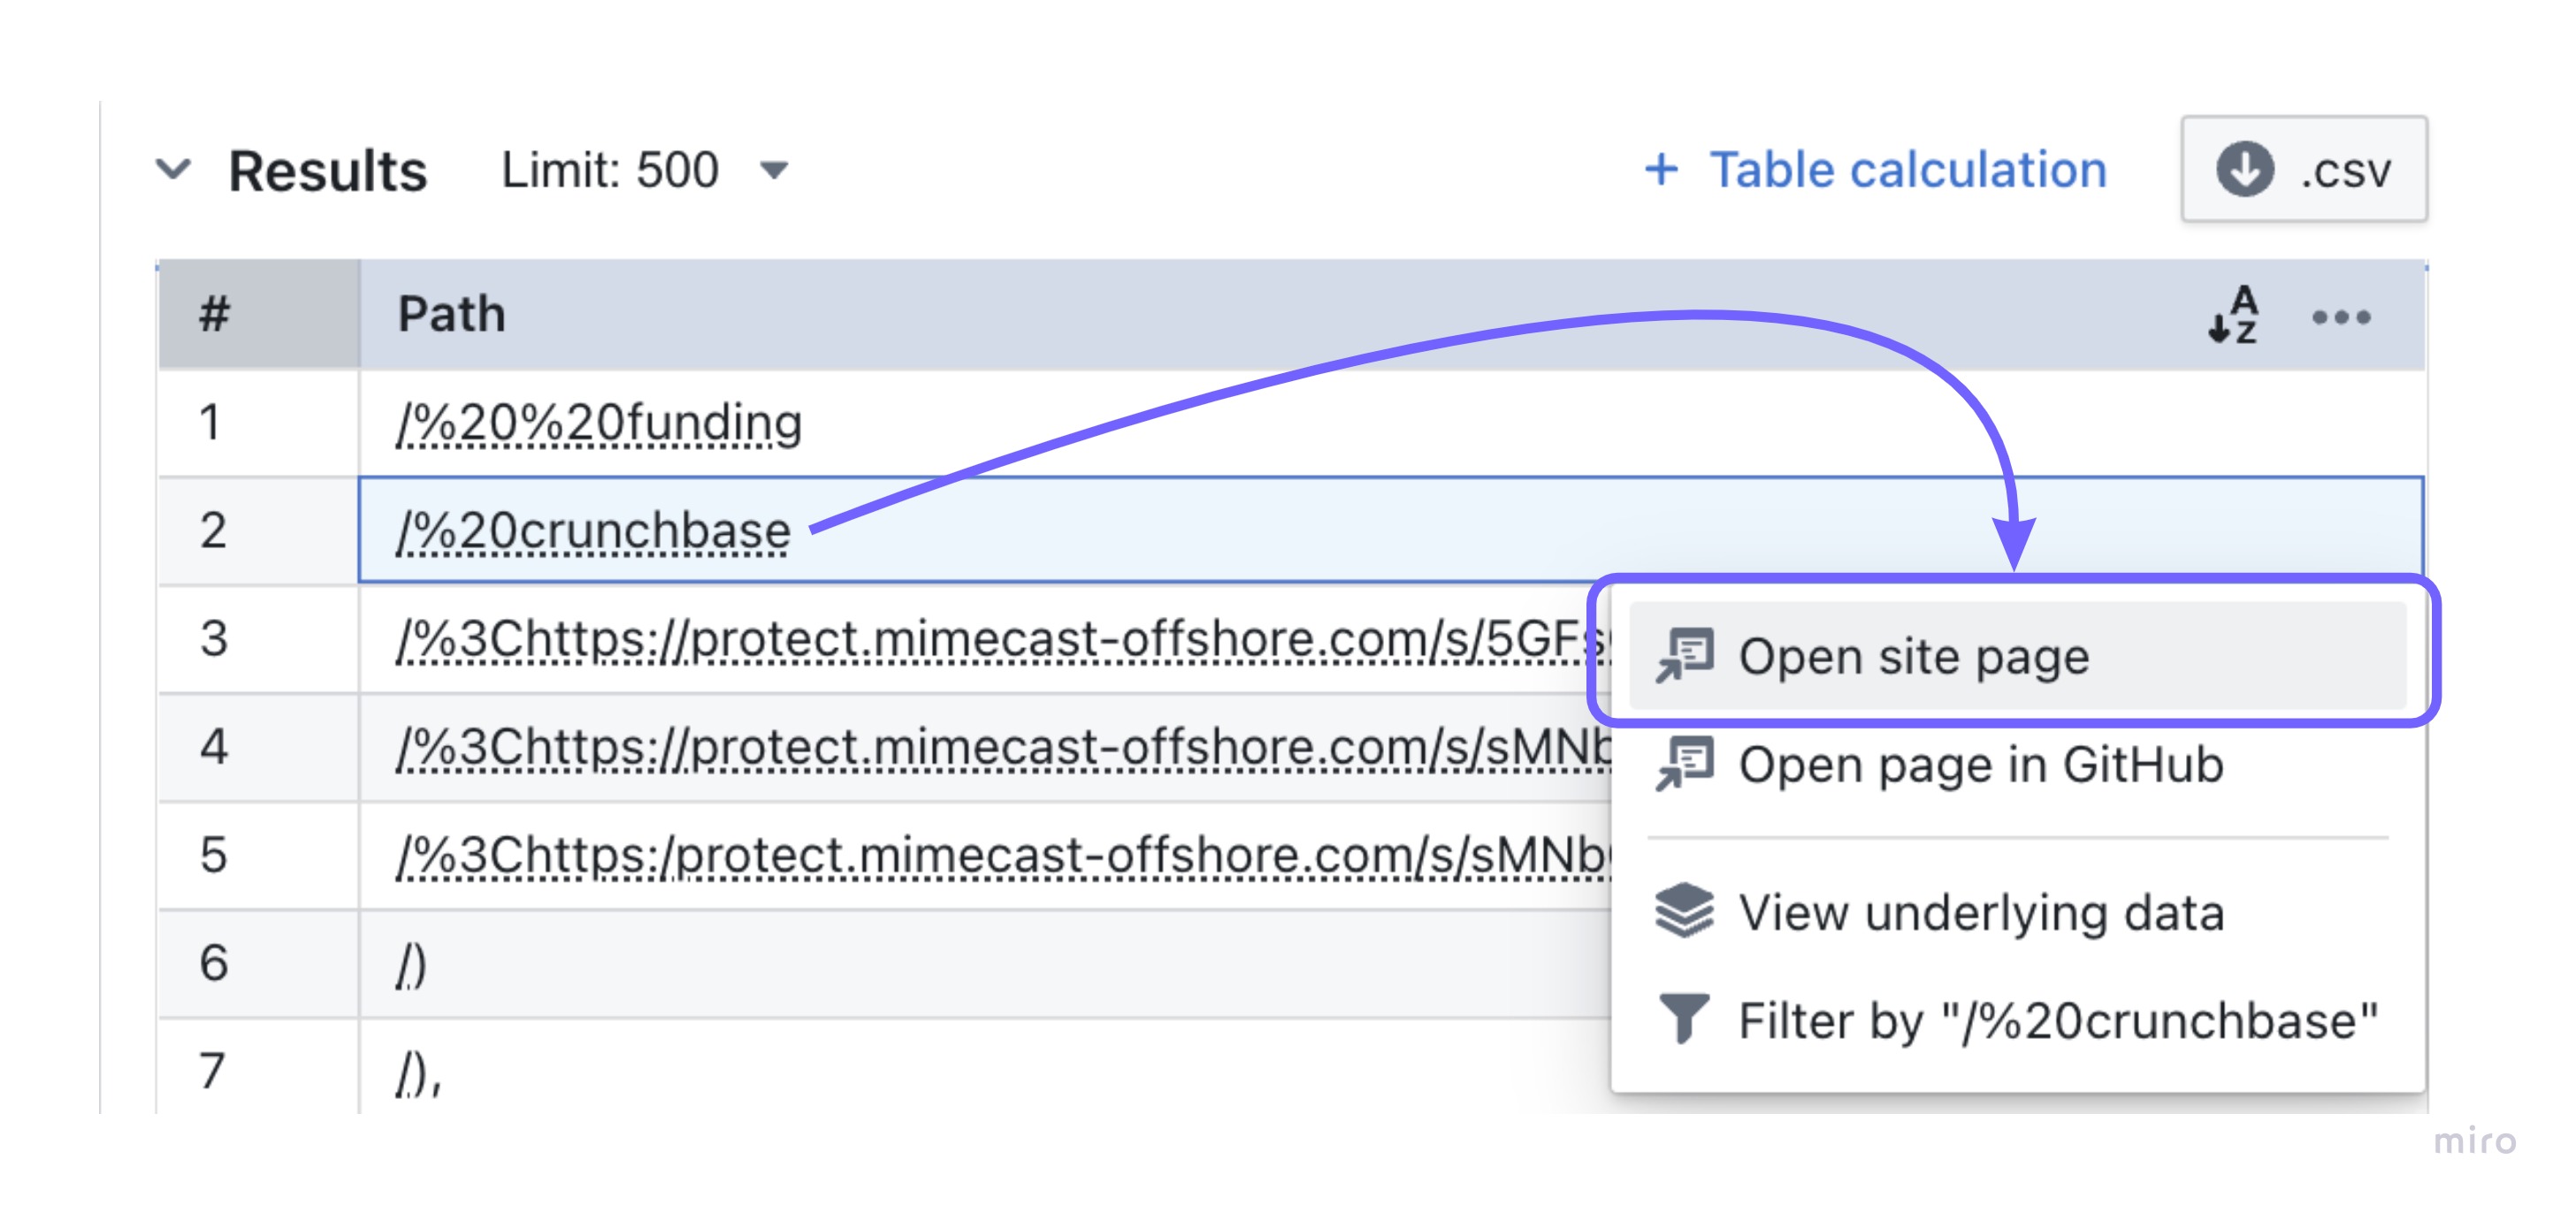
${ value.formatted } will be replaced with the value of the company name in the Lightdash UI at query run time. The ${ row.company.company_id.raw } will be replaced with the value of the company id in the Lightdash UI at query run time. The action will be disabled if the column “company_id” from table “company” is not part of the query.
You can reference values from other columns in your URLs
You can reference another dimension from your table in your URL. For these URLs to work, the other column you’ve referenced needs to be included in your results table. For example, say I’ve added a URL tocompany_name and it uses the field customer_id:
customer_id included in my results table.
Liquid Templating
Use templates to configure the url values depending on the query, this allows your urls to depend on the results of queries. Available liquid tags
Available liquid filters
Filters can be used to make small transformations of your values:
There are many more filters available in the Liquid documentation.
Required attributes
Lightdash can useuser attributes to limit some dimensions to some users.
In the example below, only users with is_admin attribute true can use the salary dimension on user table. Users without access to this dimension will not see it or the custom metrics created from this dimension on the explore page.
Forbidden error.
Current limitations
Lightdash dimensions and custom metrics are protected by this feature, however, it is possible to write custom SQL to bypass this filter, for example:- Developers and admins running SQL queries on SQL runner.
-
Custom SQL or subqueries on
table calculations
Scheduler deliveries will run against the user who created the scheduled delivery, be careful when sharing required attributes with other users.
Color
You can predefine colors for your string type dimensions, these colors will be used instead of your default organization colors for the right value when you use a grouped bar chart or a pie chart.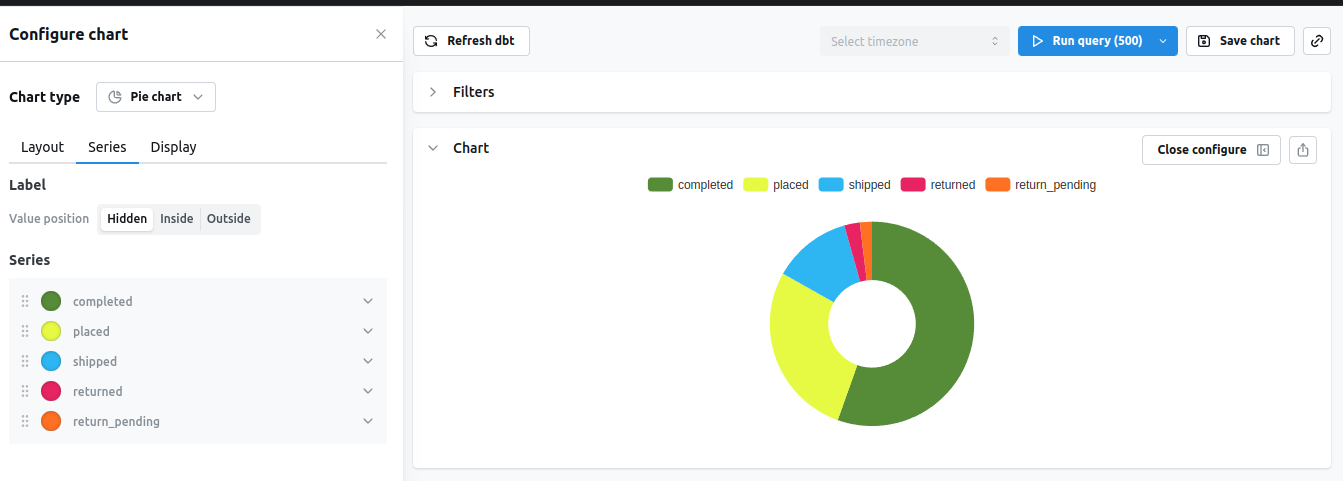
We recommend using #HEX colors, other color types like rgba,rgba or color name (eg: orange) are also supported on charts, but they are not yet supported on the chart config.
You can manually override these dimension colors by going into the chart config and manually picking a color for that serie.These colors will also take precedence over the organization color palette.
Using special characters or capital letters in your column names
If you use special characters on your column names, you might get errors when using those columns on explore. For example, having a column namedStatus with capital S on a table named orders in postgres throws the following error:
sql meta tag on dimensions
Status columns on the SQL query
Additional dimensions
Additional dimensions let you define multiple dimensions off of a single column from your dbt model. This is useful when adding different formatting to a column, comparing or combining columns, parsing JSON columns, or creating persisted groups/buckets based off of a column. A “normal” dimension is a column created in your .sql file in dbt that is written to your data warehouse. An additional dimension is not included in your dbt .sql file, so it’s not written to your data warehouse. When used in Lightdash, it just adds the dimension definition to your SQL query (so it’s “created” at runtime). All dimension configurations are available for additional dimensions. You can also use additional dimensions when defining metrics.Additional dimensions names need to be unique in the model.
Adding different formatting
Comparing or combining columns
When defining additional dimensions, you can reference other dimensions, even from joined tables (organizations is a joined table in the example below).
Parsing JSON columns
Usually you’ll want to addhidden:true for the main JSON dimension since raw JSON is not useful in charts.